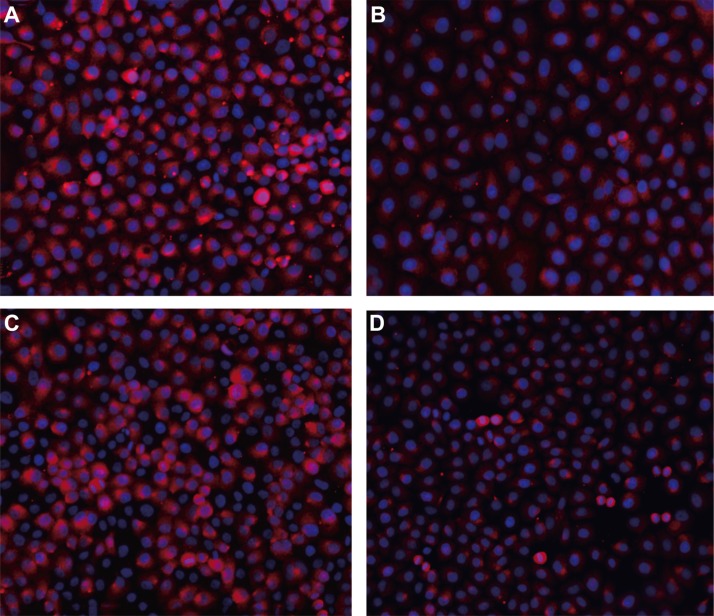
Figure 4. Immunofluorescence staining of E-cadherin expression in SGC-7901 and KATO-III cells after TGF-β1 treatment for 48 h (×200).
(A) E-cadherin expression in SGC-7901 cells in the BSA control group; (B) E-cadherin expression in SGC-7901 cells with TGF-β1 treatment; (C) E-cadherin expression in KATO-III cells in the BSA control group; (D) E-cadherin expression in KATO-III cells with TGF-β1 treatment). Note: TGF-β1, transforming growth factor β1; GC, gastric cancer; BSA, bovine serum albumin.

