
Figure 8.
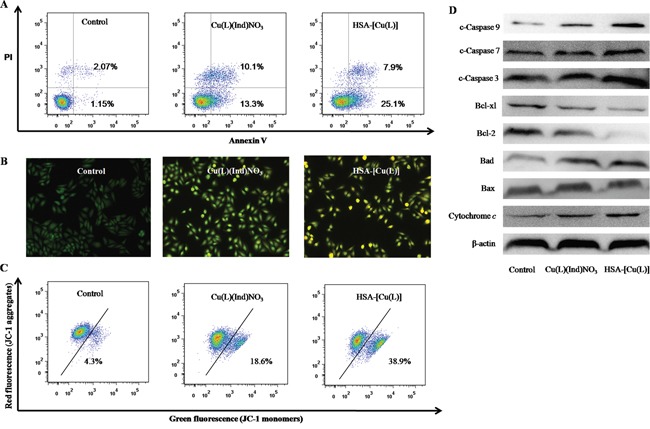
A. Representative dot plots of PI and Annexin V double staining on the MCF-7 cells in the presence of the indicated concentration (1.4 μM) of [Cu(L)(Ind)NO3] and HSA-[Cu(L)]. B. Representative images of AO/EB double stained MCF-7 cells after treatment with complexes [Cu(L)(Ind)NO3] and HSA-[Cu(L)] the indicated concentration (1.4 μM). C. Effects of [Cu(L)(Ind)NO3] and HSA-[Cu(L)] at the same concentration (1.4 μM) on mitochondrial membrane potential analyzed by JC-1 staining and flow cytometry. D. The expression levels of the Bcl-2 family proteins and the caspase family members in Bel-7402 cells induced by [Cu(L)(Ind)NO3] and HSA-[Cu(L)] at the same concentration (1.4 μM) for 24 h.