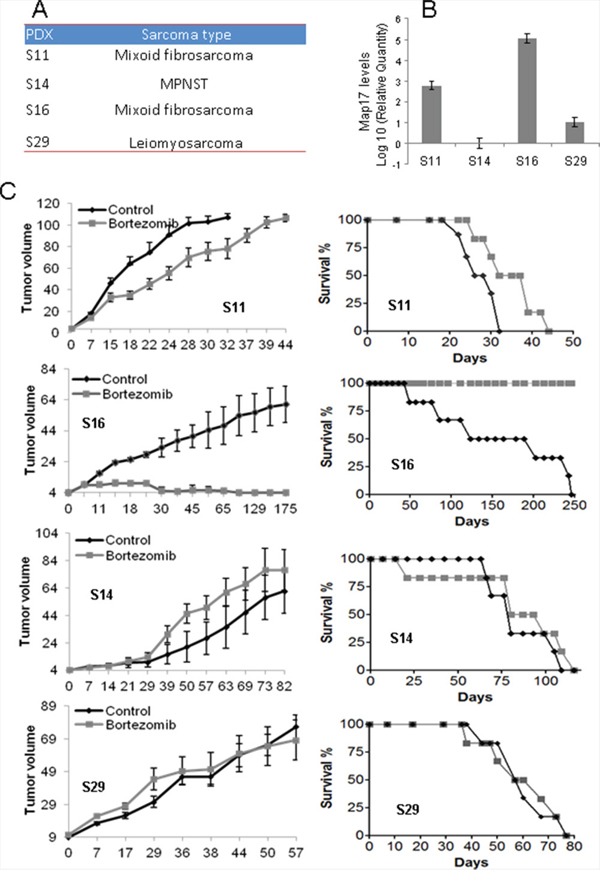
Figure 5. Effect of bortezomib on sarcoma tumors in vivo.

A. PDX models used in this study. B. Levels of MAP17 mRNA in each model. C. Response to bortezomib. The left graph shows the average ±SD of tumor growth. The right graph shows the survival of the mouse cohorts with sacrifice by humane endpoint when the tumor reaches 1000 mm3. The sarcomas were subcutaneously engrafted and grown until all of the tumors reached 20 mm3 in volume. The mice were then treated for 4 weeks (5 days/eek). The cohorts of mice were either treated with bortezomib (1.0 mg/kg body weight, in 0.9% NaCl) or saline serum (0.9% NaCl). The mice were monitored daily for signs of distress and were weighed twice a week. The tumor size was measured using a caliper according to the following equation: tumor volume = [length × width2]/2. The experiments were terminated when the tumor reached 1000 mm3.
