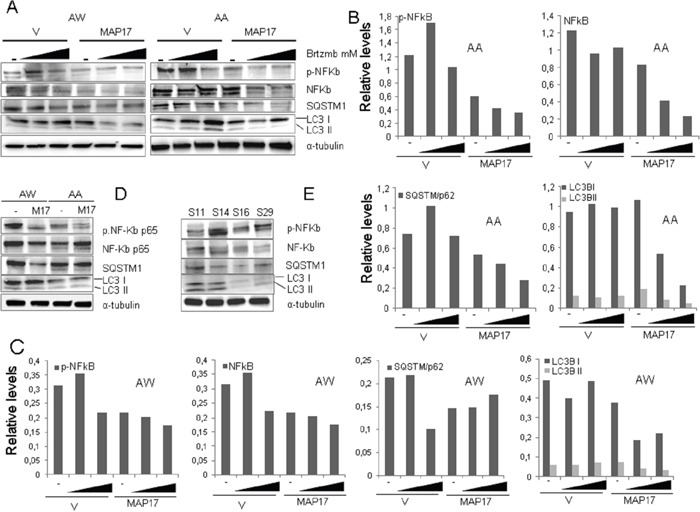
Figure 6. Levels of NFκB and autophagy in sarcoma tumors or cell lines expressing MAP17.

A. Western blots showing the levels of different basal protein levels in sarcoma PDX models. NFκB-p65 phosphorylated at Ser536, total NFκB-p65, LC3B and p62. Treatment with bortezomib was performed for 24 hrs. B. Quantification of Figure 6A, cell line AA. C. Quantification of Figure 6A, cell line AW. D. Western blots showing the levels of different proteins in AA and AW sarcoma cell lines overexpressing MAP17 or empty vector only. NFκB-p65 phosphorylated at Ser536, total NFκB-p65, LC3B and p62. Quantification is shown in Figure 4A. E. Western blots showing the levels of different proteins in AA and AW sarcoma cell lines overexpressing MAP17 or empty vector only, in response to bortezomib (+) or to solvent only (−). NFκB-p65 phosphorylated at Ser536, LC3B and p62 levels are shown. Quantification is shown in Figure 4B.
