
Figure 2. A. PLS-DA-derived score plot for mammary epithelial and metastatic breast cancer cells (n = 5 for each group). B. PLS-DA loading plot of variables with a VIP value of >1.1 explaining the separation above.
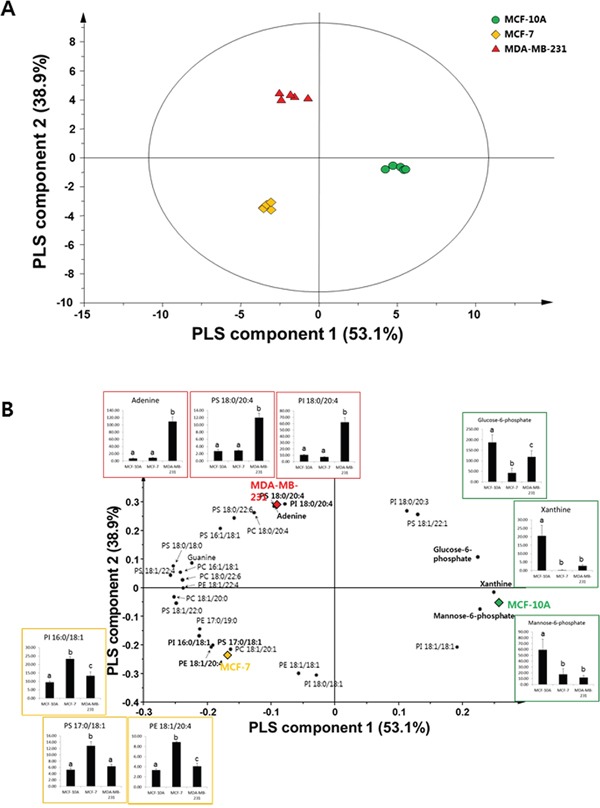
The graphs show changes in major compounds in each group. Data represent mean values with error bars representing the standard deviation values. Different letters on the graph indicate statistically significant differences between samples based on ANOVA with Tukey’s post hoc test. ●: MCF-10A; ♦: MCF-7; ▲: MDA-MB-231