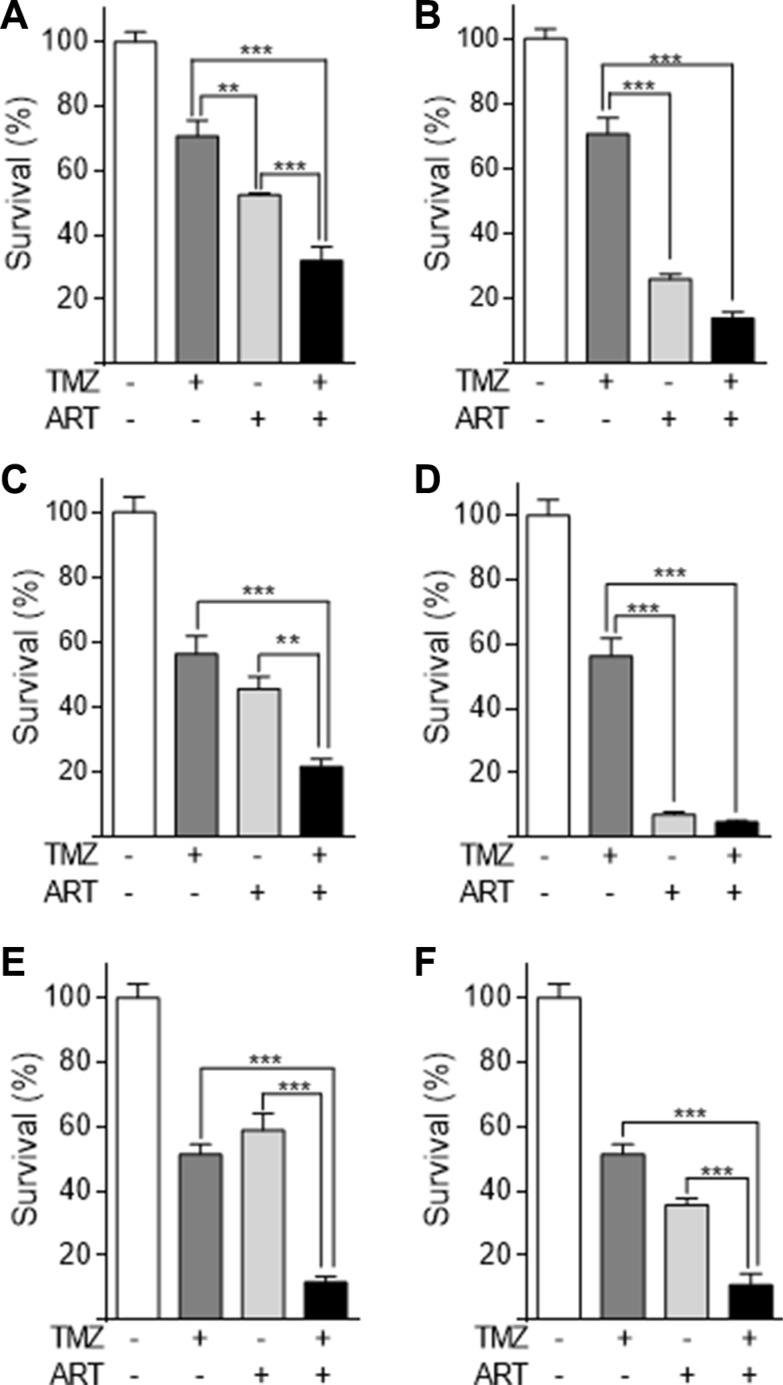
Figure 3. Colony formation assay of glioblastoma cell lines LN229, A172, U87MG treated with TMZ, ART or combined treatment.
(A) LN229 cells were treated with 2.5 μM TMZ and/or 3.8 μg/ml ART. (B) The same experiment using 7.5 μg/ml ART. (C) A172 cells were treated with 2.5 μM TMZ and/or 3.8 μg/ml ART. (D) The same experiment using 7.5 μg/ml ART. (E) U87MG cells were treated with 10 μM TMZ and/or 3.8 μg/ml ART. (F) The same experiment with 7.5 μg/ml ART. All data are the mean +/− SD of at least three independent experiments.

