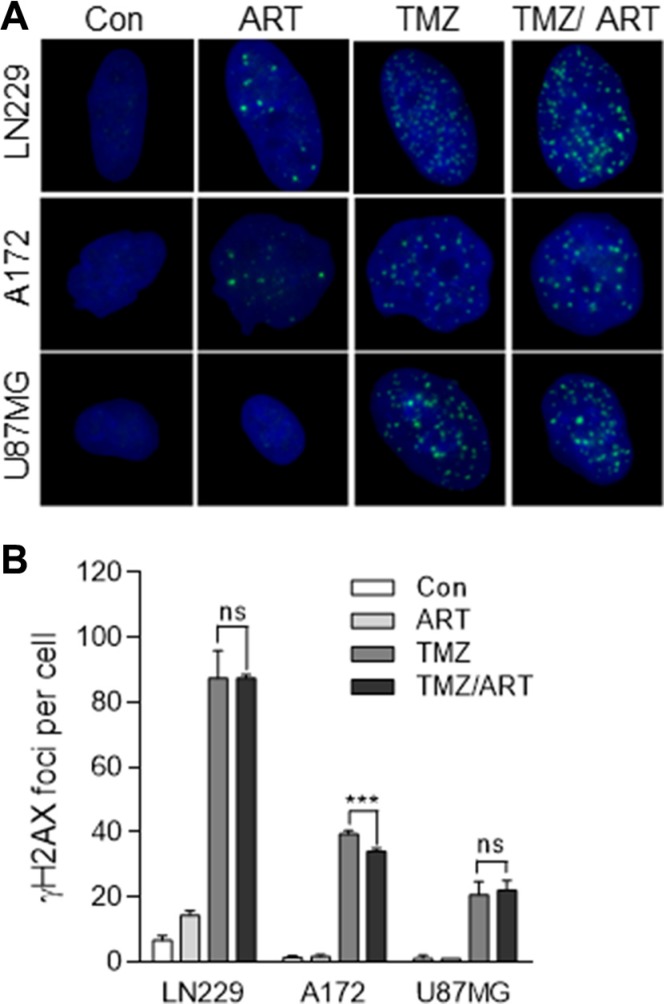
Figure 5. DSB formation in glioblastoma cells (LN229, A172, U87MG) following TMZ and ART.
Cells were exposed to single or combined treatment with 50 μM TMZ and 15 μg/ml ART. Analysis was performed 96 h after TMZ treatment. Addition of ART occurred 72 h after TMZ treatment. γH2AX foci formation was analyzed by immunofluorescence. (A) Representative images of stained nuclei. γH2AX foci are stained in green. Nuclei are counterstained with DAPI in blue. (B) Mean number of foci per cell. In each experiment foci in at least 50 nuclei per treatment were determined. Con, untreated control. All data are the mean +/− SD of at least three independent experiments.

