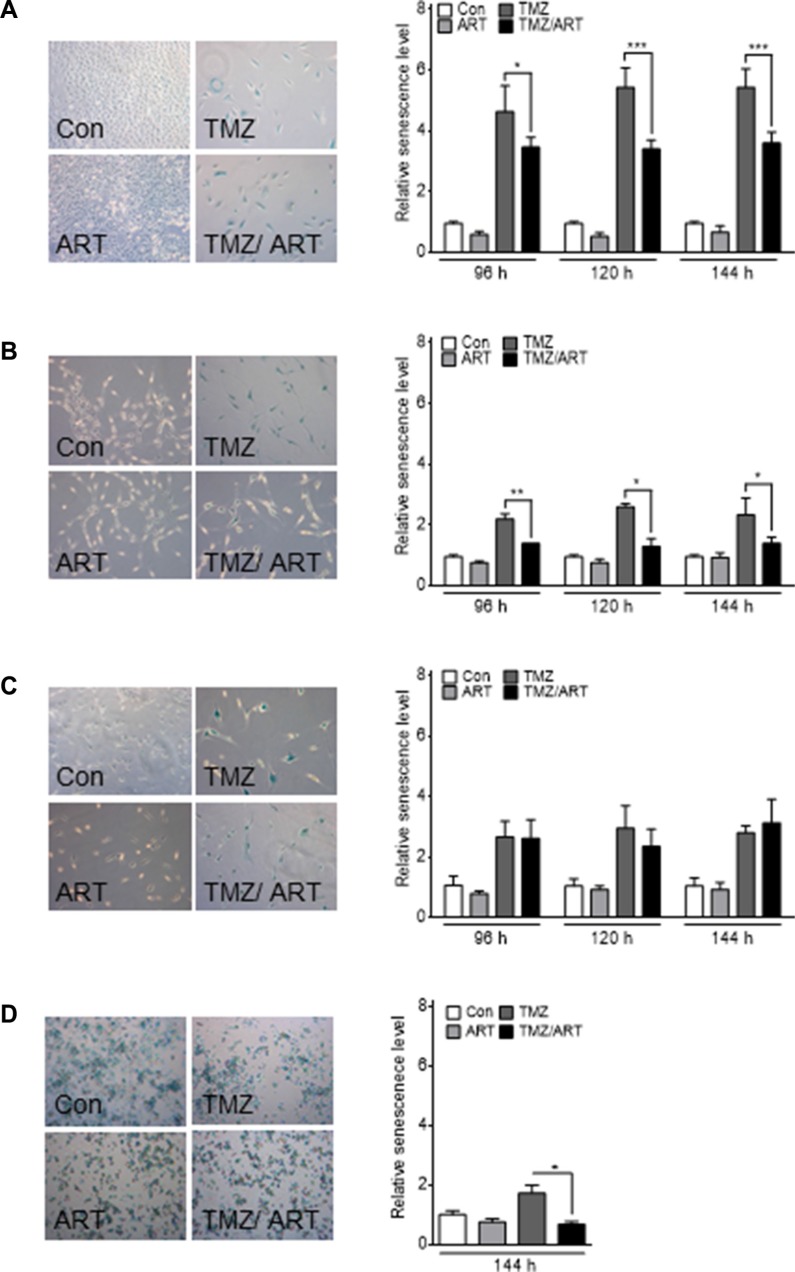
Figure 8. Induction of senescence analyzed by the C12FDG assay in glioblastoma cell lines.
Cells were treated with 50 μM TMZ and/or 15 μg/ml ART. For G112SP stem-like cells 2 μM TMZ was used. Analysis was performed 96, 120 and 144 h after the onset of treatment. Treatment with ART occurred 72 h after the onset of TMZ treatment. The senescence level was normalized to the untreated control. Representative pictures of SA-β-gal staining are shown in the left panels for (A) LN229, (B) A172, (C) U87MG and (D) G112SP cells. All data are the mean +/− SD of three independent experiments.

