
Figure 1. CT-26 cell-derived exosomes are sufficient to transform cancer cell-favorable macrophages.
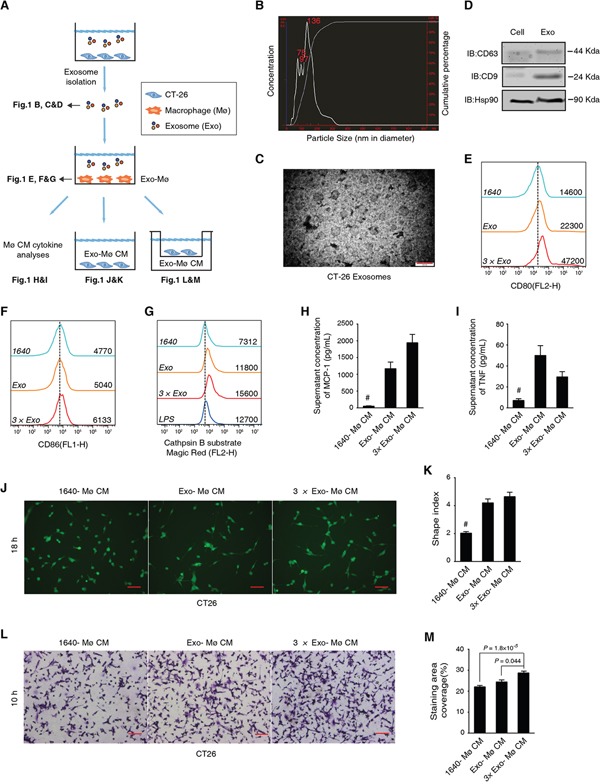
A. Schematic diagram of the experimental design and results shown in each panel. Mø stands for macrophages, Exo for exosomes, and CM for conditioned media. B. Size distribution of CT-26 exosomes determined by NanoSight. C. TEM observation of CT-26 exosomes. Scale bar = 200 nm. D. Immunoblotting analysis on the exosomal biomarkers CD63, CD9 and Hsp90. E, F. Maturation analysis of CT-26 exosome-educated BMMs. Different doses of exosomes, 1× (Exo; the exosome secreted from 3.5×10⁶ cells) or 3× Exo, were added into BMM cultures. FCM results on CD80 (E) and CD86 (F) are respectively shown with fresh RPMI 1640 (1640) cultured cells as the negative control. The mean fluorescent intensities (MFIs) of each group are shown on the right side of each curve. The dashed line indicates the peak value of the negative control group. G. FCM assay on cathepsin B activity in live cells. LPS-treated BMMs were used as a positive control. H, I. Cytometric bead array assays (CBA) analysis on the BMM cytokine secretion. Statistical results of MCP-1 (H) and TNF (I) are shown. #P < 0.01, n = 3, compared with any of the other groups, respectively. J, K. Representative CFSE staining image (J) and statistical analysis on the shape index of CT-26 cells (K). Scale bar = 20 μm; #P < 0.01, cell n = 80, compared with any of the other groups. L, M. Representative images (L) and statistical comparisons of the transmembrane cell staining area of CT-26 cells. Scale bar = 20 μm (M). CT-26 cells were induced to migrate toward different CM. Data are shown as mean ± s.e.m. and n = 3.