
Figure 2. Endpoint tracing of CT-26 exosome transported proteome in macrophages.
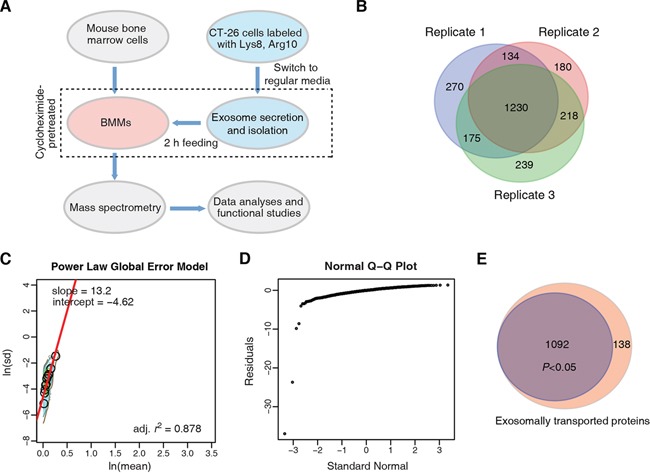
A. Strategy for the exosomally transported proteome study. B. Venn diagram comparison of exosomally transported proteins identified and quantified in macrophages, acquired from three independent biological replicates. C. PLGEM analysis for detecting transported proteins with statistically consistent relative abundance. The protein standard deviations (In(sd)) and means (In(mean)) were linearly fitted by PLGEM. D. Q-Q plot. E. Venn diagram that shows the fraction of DEPs.