
Figure 6. CT-26 exosome proteome is not a random incorporation of CT-26 cell proteome.
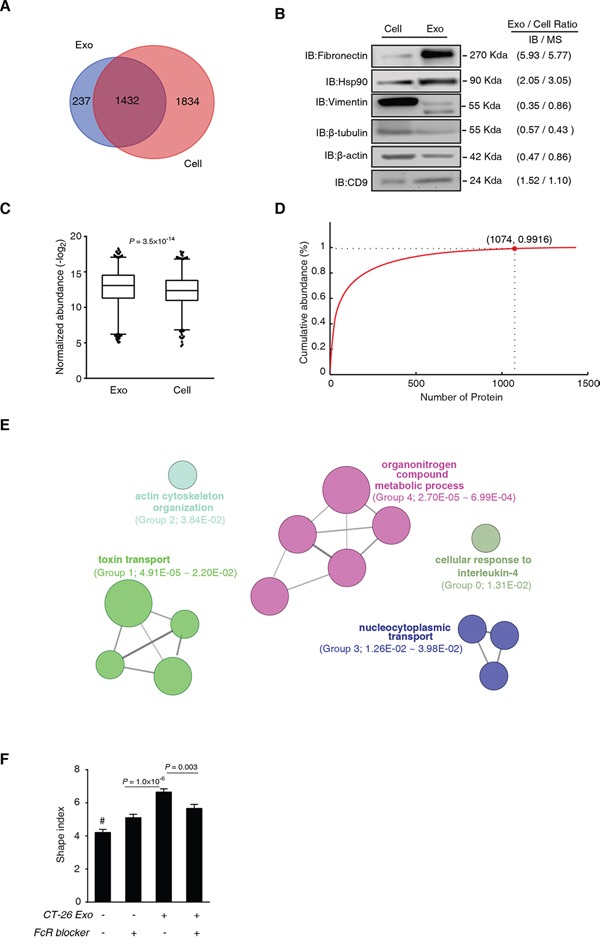
A. MS identification comparison of CT-26 cells and CT-26 exosomes. B. Immunoblotting validation of label-free MS quantification. The grey-scale comparison of protein expression ratio of exosome versus cell (Exo/Cell ratio) between IB and MS is shown on the right side of the IB images. C. Statistical comparison of the protein abundance distribution of the overlapped proteins identified in CT26 cells and CT-26 exosomes. Box-plot shows the median, quantiles and 5% outliers, respectively. KS test was used to test the significant difference in abundance distribution. D. Cumulative curve of CT-26 exosome proteins. Horizontal axis indicates proteins from the maximum to the minimum abundance in a ranking order. The red dot depicts the first three quartiles, and the cumulative protein abundance at this point. E. ClueGO+CluePedia analyses of the exosomally enriched proteins in the first 3 quartiles in (D). F. Effects of FcR blocking and CT-26 exosomes induced macrophage cytoskeleton rearrangement. Day 3 BMMs were treated by CT-26 exosomes with or without FcR-blocker (10 μg/mL) for additional 3 d. #P<0.0001, compared with any of the other groups. All the images were acquired from five random high power fields of the coverslips, and more than 200 cells were measured for each group. Data are shown as mean ± s.e.m. Statistical difference was tested by one-way ANOVA with Bonferroni post hoc multiple comparisons (two-tailed).