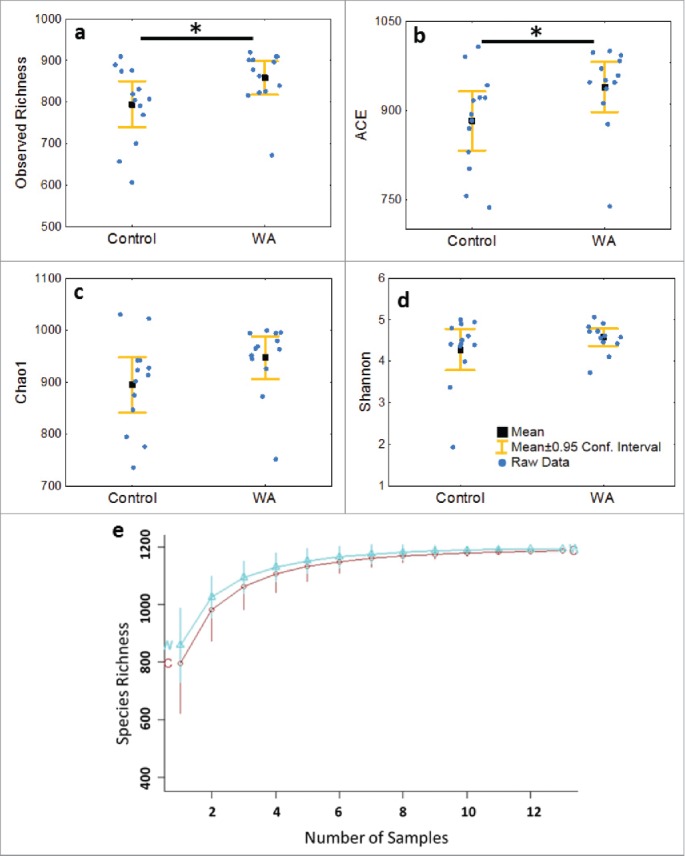
Figure 1.

a) Observed Richness and the b) ACE diversity indices indicate significantly (*p < 0.05) increased diversity in the microbiome of WA animals, the c) Chao1 index tended to significance (p = 0.05), whereas the d) Shannon's index and e) Species Accumulation curve did not show differences in diversity in the microbiome of Control and WA animals.
