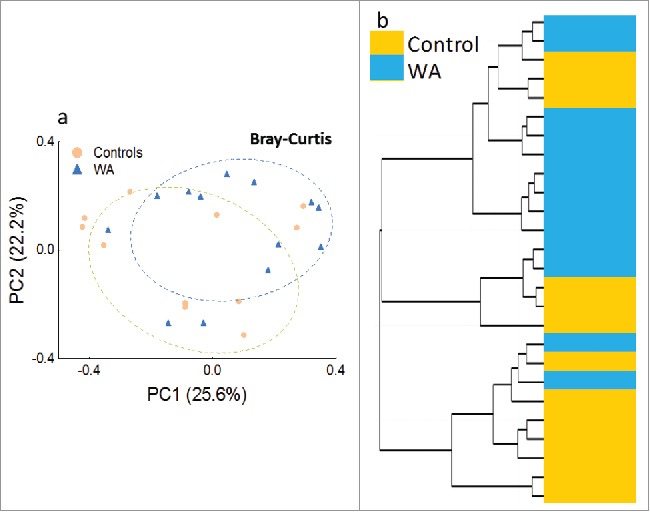
Figure 2.

a) PCoA of abundance based Bray-Curtis distances of the colonic microbiome from control (orange) and WA (blue) rats plotted on the first 2 principal coordinates (PC) which account for approximately 48% of the observed variation b) Hierarchical clustering using Ward's method on Bray-Curtis distances reflect the clustering of microbial communities by treatment condition (Control and WA stress) observed in the PCoA analysis.
