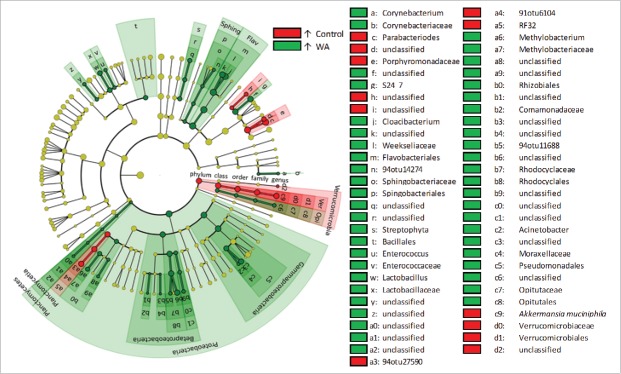
Figure 4.
Circular cladogram of statistically and biologically consistent differences in colonic microbial clades between WA and control animals. Red indicates higher abundance in control animals, green indicates higher abundance in WA animals and yellow is non-significant. Each circle's diameter is proportional to the taxon's abundance. The cladogram simultaneously highlights high-level trends and specific genera/species. Abbreviations: Sphing: Sphongobacteriia, Flav: Flavobacteriia, Ver: Verrucomicrobiae, Opi: Opitutae.

