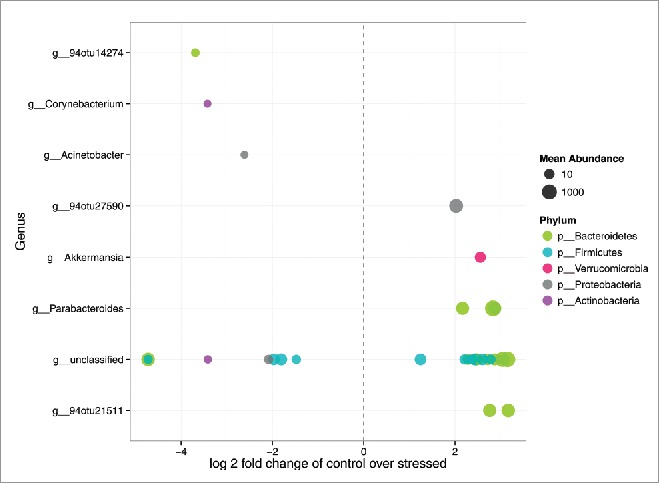
Figure 6.

Differentially abundant features. Each point represents an OTU belonging to each Genus. Features were considered significant if their FDR-corrected p-value was less than or equal to 0.05, and the absolute value of the Log-2-fold change was greater than or equal to 1.
