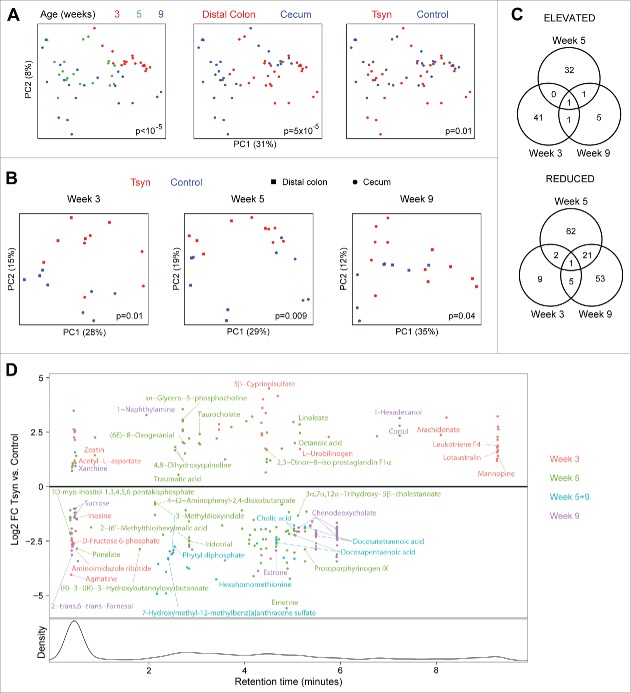
Figure 5.
Tsyn mice have age-dependent alterations in the colonic metabolome. (A) PCoA plots for metabolomics data from Tsyn and control mice at weeks 3 (disease onset), 5 (remission), and 9 (relapse). Samples are colored by age, location, and genotype. P-values for the difference in metabolomics profiles across all groups were calculated by Adonis. (B) PCoA plots for metabolomics data stratified by age. (C) Venn diagrams show the number of metabolites enriched or depleted in Tsyn vs. control mice, comparing weeks 3, 5, and 9. Differential abundance was determined from multivariate models adjusting for location (distal colon, cecum) and genotype. (D) Log2 FC for metabolites with a statistically significant difference in abundance between Tsyn and control mice at week 3, 5, or 9. Metabolites overlapping between weeks are plotted based upon FC at week 9. The lower panel shows the density of detected spectral features by retention time. Metabolites with a putative identification based upon m/z are annotated.

