
Figure 1. An in vivo shRNA screen identifies Ptcd3 as a critical Myc effector.
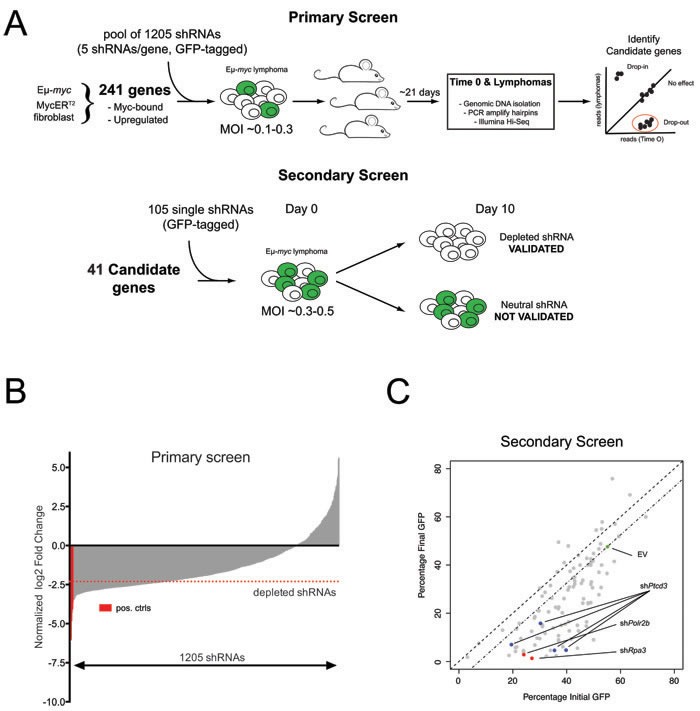
A. Schematic of the primary and secondary screens. Eμ-myc lymphoma cells were transduced with a pool of 1205 shRNAs and then injected into recipient mice. shRNA representation in lymphomas was assessed by high-throughput sequencing. Candidate genes from the primary screen were further validated in a secondary in vitro GFP screen as depicted. B. Bar-plot summarizing the results of the primary screen. The average log2 fold change for each shRNA among the four replicates is shown relative to the input population. shRNAs are rank by ascending values. shRNAs targeting known essential genes (Polr2b, Rpa1 and Rpa3) are marked in red. A red dotted line indicates the threshold for negative selection (log2FC < −2.3). Candidate genes for the secondary screen were selected based on the number of depleted shRNAs and functional annotation. C. Scatter plot summarizing the results of the secondary validation screen. The highlighted dots show cells transduced with the control empty vector (EV, green dot), two shRNAs against essential genes (Rpa3 and Polr2b, red dots) or four different shRNAs against Ptcd3 (Blue dots). Grey dots show all other shRNAs included in the secondary screen. The percentage of transduced GFP+ cells at Day 0 is reported on the X-axis while the Y-axis shows the fraction of remaining GFP+ cells following 10 days of in vitro culture.