
Figure 3. Tigecycline impairs the growth of Eμ-myc lymphoma cells and inhibits translation of mitochondrial proteins.
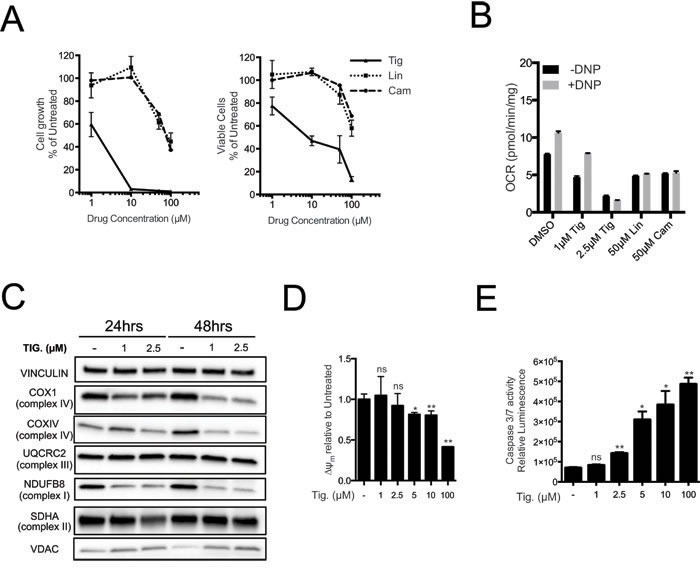
A. Dose-response curve of Eμ-myc lymphoma cells treated with the indicated doses of Tigecycline (Tig), Linezolid (Lin) or Cloramphenicol (Cam) for 48hrs. Data are shown as cell numbers (left panel) or viability (right panel), as percentage of untreated cells (mock-treated with DMSO). Cell number and viability was determined by trypan blue staining. B. Oxygen consumption rate (OCR) measured as defined in Figure 2F on Eμ-myc lymphoma cells treated with the indicated antibiotics or carrier (DMSO). To measure spare respiratory capacity, cells were treated with the ETC uncoupler 2,4-Dinitrophenol (DNP). C. Western blot analysis of components of the ETC complexes I-IV. Cells were treated with the indicated concentration of Tigecycline for 24 or 48hrs. The loading controls are Vinculin and VDAC, as in Figure 2D. D. Mitochondrial membrane potential was determined by staining with the cationic cyanine dye DilC1(5). E. Cleaved caspase 3/7 activity was determined with the caspase 3/7 glo assay luminescent kit. Measurements in D and E were taken after 6 hrs of treatment. Means, s.d. and statistical significance are as defined in Figure 2. See also Supplementary Figures S3 and S4.