
Figure 3. Heatmap for DEX-enhanced drug activity in 3 patients.
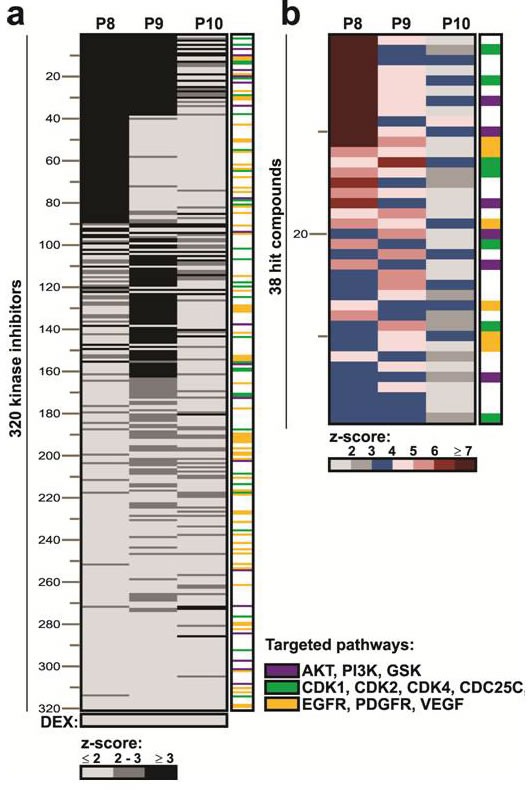
a. Three hundred twenty different kinase inhibitors (KI) were screened for DEX-enhanced toxicity against purified 2S-stimulated CLL cells from 3 patients (P8, P9, P10) using TMRE fluorescence as an indicator of mitochondrial potential and cell death. Individual patient samples are shown in columns and 320 KIs are indicated in rows. Compound activity for the synergy screen is indicated by positive z-scores for each sample as indicated by the grey scale bare below. Kinase inhibitor and DEX combination were scored as positive if z-scores were ≥ 3 (black). Compounds are ranked by average of z-score> 3 with highest z-score on top and lowest z-score at the bottom. Common pathways targeted by the kinase inhibitors are indicated by color in the last column and listed on the right. b. Magnified version of the full heat-map, showing the top 38 kinase inhibitor hits. Color scale bar indicates drug efficacy by increase in z-score. The names of all kinase inhibitors are provided in supplementary Table S2.