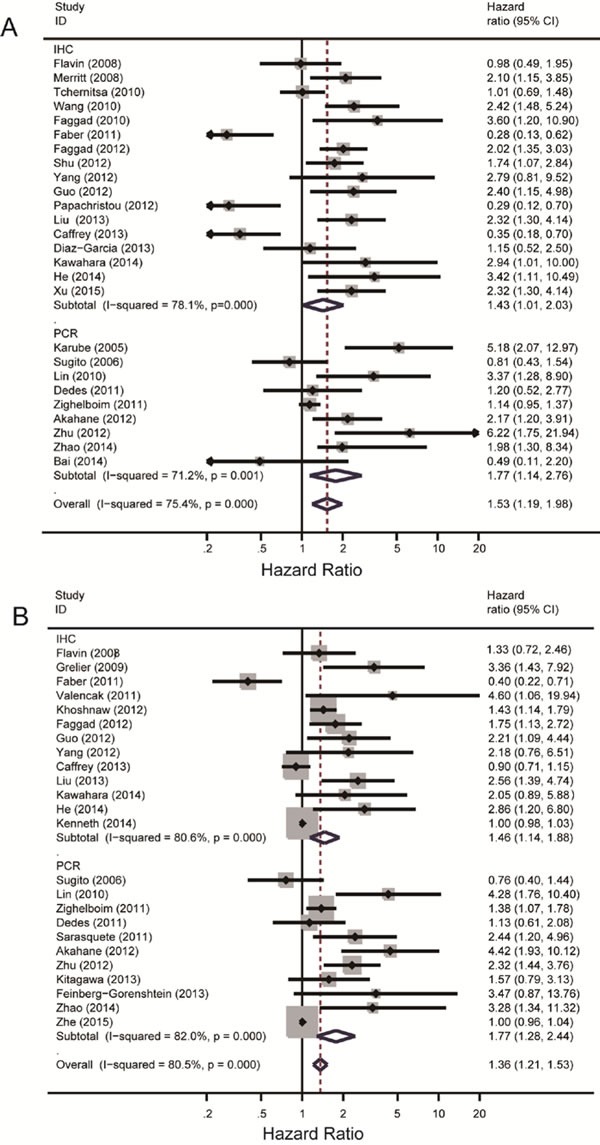
Figure 2. Summary hazard ratios and 95% confidence intervals (CIs) of cancer patients.

Horizontal lines represent 95% CIs; diamonds represent summary estimates with corresponding 95% CIs. A random-effects model was used for analysis. A. For OS group, test for heterogeneity: I2 = 78.1%, P = 0.000. A random-effects model was used for analysis. B. For PFS group, test for heterogeneity: I2 = 71.2%, P = 0.001.
