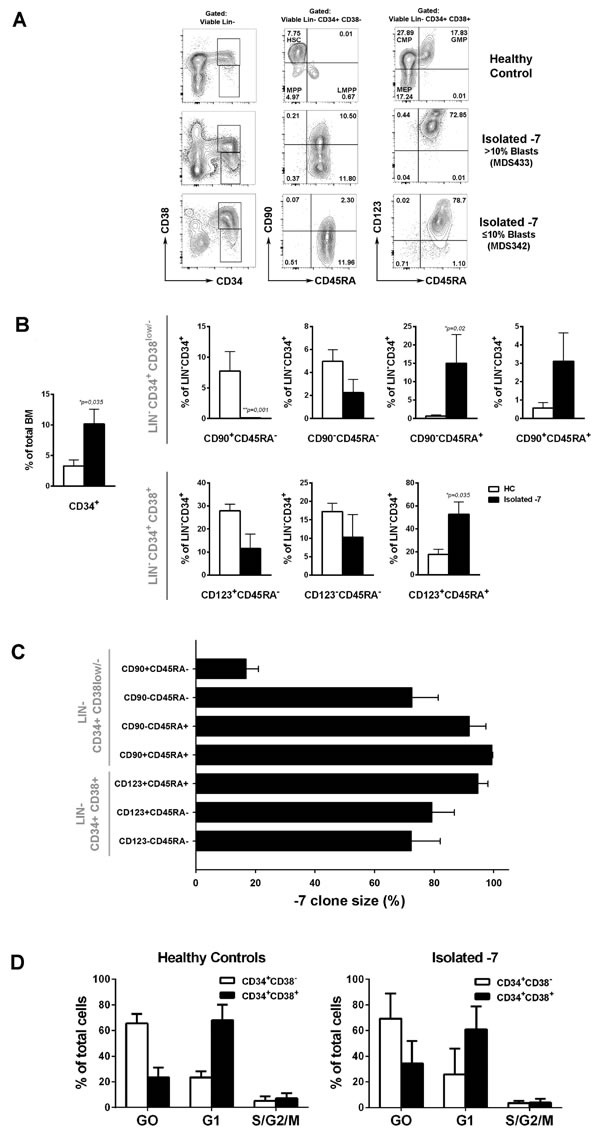
Figure 2. Phenotypic characterization and clonal involvement of stem and progenitor cells in patients with isolated monosomy 7.

A. FACS profiles of stem and progenitor cell compartments in representative BM mononuclear cells. Numbers indicate percentages of LIN−CD34+ cells. B. Mean (SEM) frequencies within total BM or within total CD34+ stem-progenitor cell compartment of healthy controls (HC; n = 6) and isolated −7 MDS cases (n = 7) *p < 0.05. C. Mean (SEM) percentage of cells with −7 as assessed by FISH in FACS-purified stem/progenitor cell populations from isolated −7 patients (n = 7). For purified LIN−CD34+CD38low/−CD90+CD45RA− cells, 9/ 72 (12,5%) nuclei were scored as monosomy 7 for MDS372 and 12/60 (20%) for MDS381. D. Cell cycle analysis from HC (n = 4) and isolated −7 (n = 4; patients MDS324, MDS260, MDS342 and MDS372) for LIN−CD34+CD38− or LIN−CD34+CD38+ subsets. Mean (SEM) frequencies of cells within Go (Ki67−7AAD+) G1 (Ki67+7AAD−) and S/G2/M (Ki67+7AAD+).
