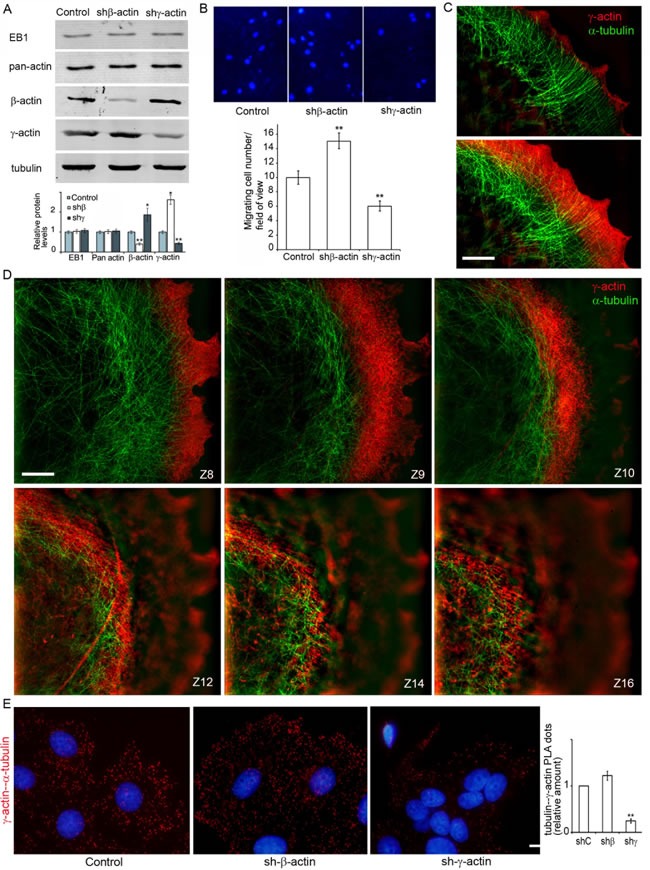
Figure 4. γ-actin-microtubule interaction after actin isoform down-regulation.

A. Down-regulation of cytoplasmic actins in MCF7 cells. WB analysis. B. Migratory activity of MCF7 cells with down-regulated β- or γ-actins. DAPI staining (upper panel) and quantification (Mean ± SEM; lower panel) of migrating cells. C., D. Close distribution of microtubules and the γ-actin network at the leading edge (C, D) and in the cortex (D). All panels represent galleries of optical sections taken with 0.12 μm step from the ventral to the dorsal side of the lamella (C) or of the cell (D), SIM. Bars, 5 μm. E. γ-actin/α-tubulin PLA analysis of MCF7 cells with down-regulated β- or γ-actins. Graph represents relative amounts of PLA dots (Mean ± SEM). Bar 10 μm.
