
Figure 5. EB1-positive comet distribution and quantification.
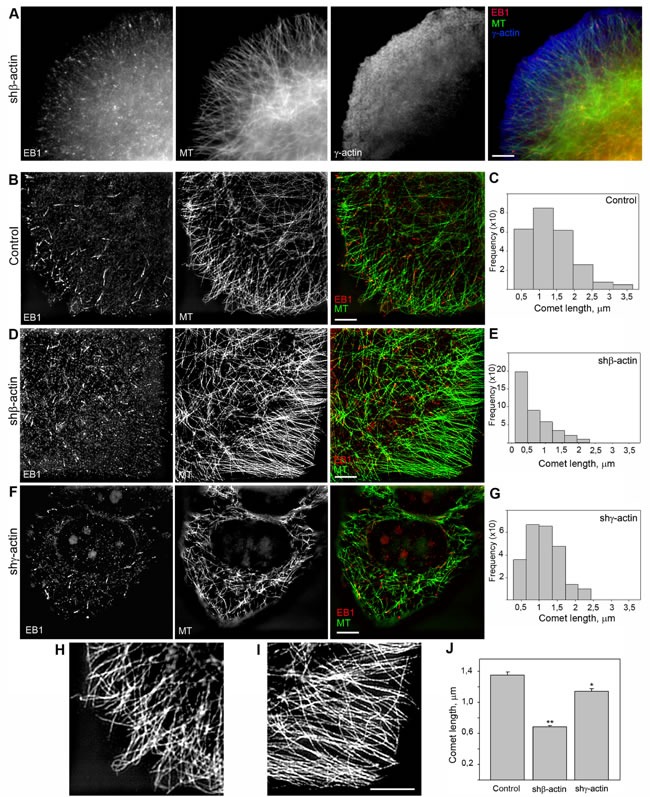
A. EB1 is located at the terminal parts of radial microtubules. Triple IF staining of tubulin, EB1 and γ-actin, 3-color SIM/STORM imaging. B., D., F. Two-color SIM imaging of EB1 and γ-actin in control (B), shβ-actin (D) and shγ-actin cells (F). C., E., G., J. Comet length quantification. H. Microtubule distribution at the leading edge of control (left) and shβ-actin (right) cells. Bars, 5 μm.