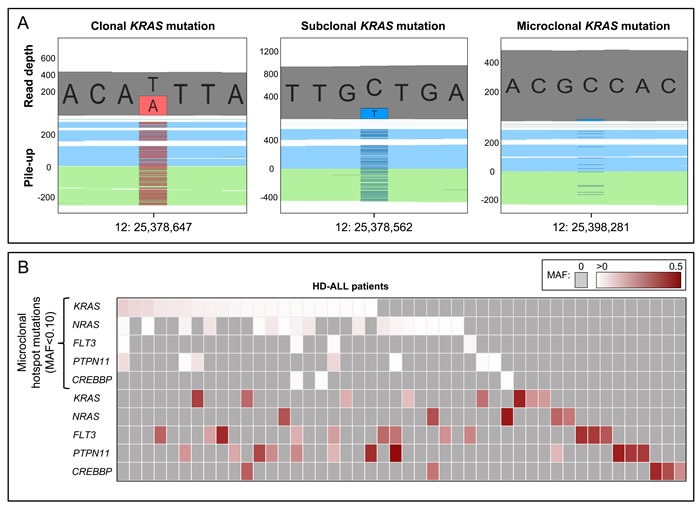
Figure 4. Clonal and microclonal tumor heterogeneity at HD-ALL hotspot loci.

A. GenomeBrowse screenshots showing clonal, subclonal, and microclonal KRAS mutations. In each screenshot, the top plot shows the total read depth and relative read depths of the reference (grey) and alternate alleles (red or blue). Bottom plots show the sequence read pile-up, split into forward (blue) and reverse (green) strands, with presence of mutant alleles shown in red or blue. The left screenshot shows a clonal KRAS T > A mutation at chr12:25,378,647 (K117N) with MAF = 0.44. The middle screenshot shows a subclonal KRAS C > T mutation at chr12:25,378,562 (A146T) with MAF = 0.20. The right screenshot shows a microclonal KRAS C > T mutation at chr12:25,398,281 (G13D) with MAF = 0.025. B. Heatmap showing the clonal and microclonal heterogeneity of HD-ALL hotspot mutations at KRAS, NRAS, FLT3, PTPN11, and CREBBP. The top 5 rows show the presence of microclonal (MAF < 0.10) hotspot mutations in codons 12, 13, 61, 117, and 146 of KRAS and NRAS; codon 835 of FLT3; codons 61 and 72 of PTPN11; and codon 1446 of CREBBP, across HD-ALL patients (columns). There were 21 patients with microclonal KRAS mutations (median MAF: 1.08%; range: 0.44-9.57%), 17 patients with microclonal NRAS mutations (median MAF: 1.28%; range: 0.39-5.47%), 4 patients with microclonal FLT3 mutations (median MAF: 1.03%; range: 0.66-1.97%), 7 patients with microclonal PTPN11 mutations (median MAF: 0.80%; range: 0.34-7.97%), and 3 patients with microclonal CREBBP mutations (median MAF: 0.68%; range: 0.48-1.13%). Clonal and subclonal mutations (MAF > 0.10) in the 5 genes are shown below, and include damaging mutations at additional codons. Mutations are color-coded according to their MAF as shown at the top right of the figure. Grey boxes represent patients with zero mutations. Where > 1 mutation was present in the same gene in a patient, the color of the cell represents the most clonal mutation. Patients without mutations in KRAS, NRAS, FLT3, PTPN11, or CREBBP were excluded from the figure.
