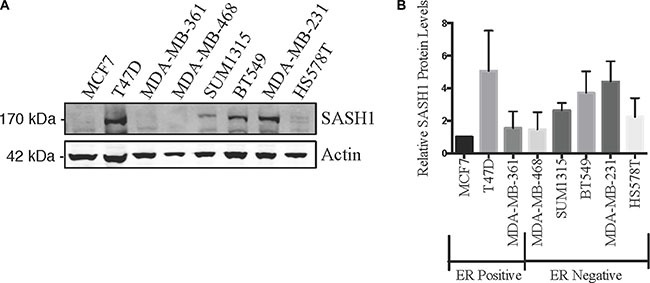
Figure 1. SASH1 protein expression in breast cancer cell lines.

Breast cancer cell lines were analysed for expression of SASH1 by immunoblotting. Representative immunoblot is shown in (A), and (B) shows densitometric quantification of SASH1 expression relative to β-actin. Data shown are means +/− standard deviation from three independent experiments, arbitrarily normalised to MCF7.
