
Figure 1. Examples of (A) high CD31 and CA9 expression and (B) low CD31 and CA9 expression in patients with pancreatic cancer adenocarcinoma.
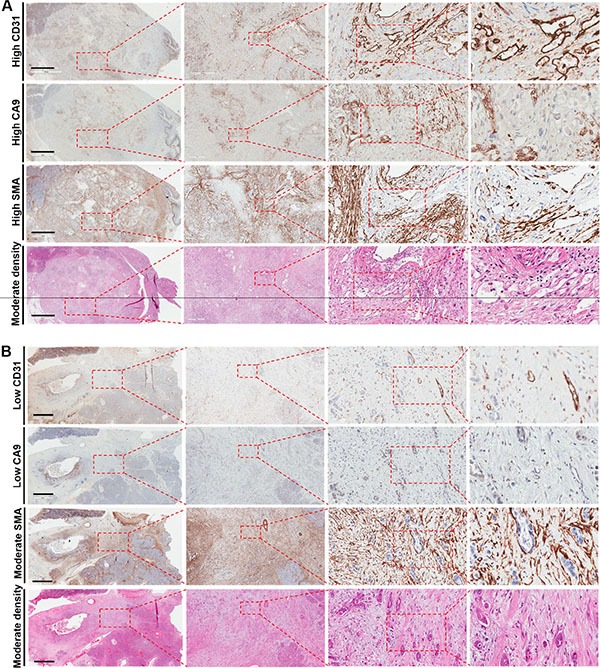
The corresponding haematoxyllin-eosin (stroma density) and αSMA (stroma activation) images are shown as well. The left panels illustrate large pancreatectomy sections (Bar: 6 mm). The magnifications of the second, third and fourth inserts from the left are × 50, × 200 and × 400, respectively.