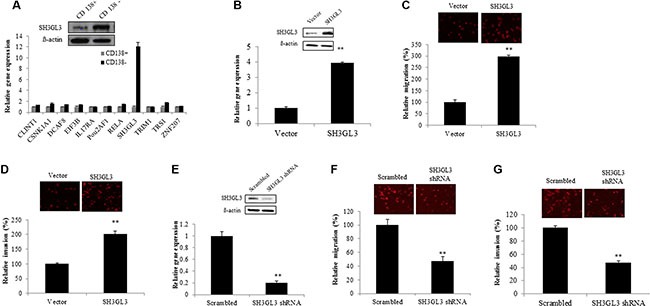
Figure 2. Overexpression of SH3GL3 enhances the migration and invasion of H929 myeloma cells; while knocking-down SH3GL3 leads to a significant reduction in U266 myeloma cells migration/invasion.

(A) The expression of selected genes in the CD138+ and CD138− U266 cells was determined using qRT-RCR (lower panel). SH3GL3 was highly expressed in CD138− U266 cells and this gene was verified using western blotting at the protein level (upper panel). (B) The protein (upper panel) and mRNA (lower panel) levels of SH3GL3 in H929 cells infected with SH3GL3 cDNA lentiviral particles (expressed as SH3GL3) and empty vectors. (C) Transwell migration assay showed the number of migrated cells. (D) Transwell matrigel-coated invasion showed the number of invaded cells. (E) Western blotting and qRT-PCR analysis showed the protein (upper panel) and mRNA (lower panel) levels of SH3GL3 in the U266 cells infected with SH3GL3 shRNA lentiviral particles and scrambled vector. (F) Transwell migration assay showed the number of migrated cells. (G) Transwell matrigel-coated invasion showed the number of invaded cells. The relative value (%) was calculated as the ratio of the number of treated cells and the number of vector control. Cells were labeled using Dil dye. The images were acquired with an Olympus microscope. The results are representative of 3 independent experiments and shown as mean ± SE, **p < 0.01.
