
Figure 4. Influence of Asp-UA on the cell surface adhesion molecules.
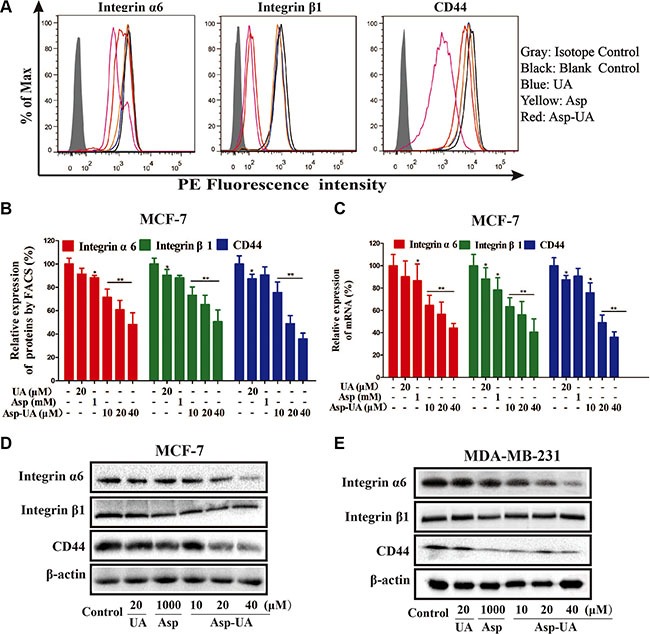
(A) Expression of integrin α6, β1 and CD44 on MCF-7 cells was determined by flow cytometry, isotype control (gray area), control (black curve), blue curve (15 μM UA), yellow curve (1 mM Asp) and red line represents Asp-UA treated group at concentrations of 20 and 40 μM, respectively. (B) The inhibitory effects of UA/Asp/Asp-UA on the expression of integrin α6, β1 and CD44 by FACS. (C) qRT-PCR on MCF-7 cells. (D) The expression of integrin α6, β1 and CD44 by western blotting in MCF-7 cells. (E) MDA-MB-231 cells. Data are obtained from 3 separate experiments and bars represent the mean ± SD. (*P < 0.05, **P < 0.01 in comparison with control).