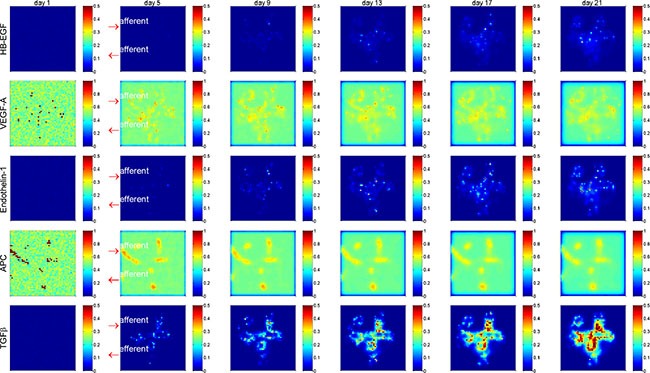
Figure 4. Spatial and temporal distribution of critical cytokines in a glomerulus under high glucose condition.

Shown is 2D section view of spatial distribution at y = 0. Deleterious cytokines HB-EGF, Endothelin-1 and TGFβ were accumulated and salutary signaling proteins VEGF-A and APC were gradually diminished over time. Red arrows indicate the afferent and efferent arterioles of the glomerulus. See Supplementary Figures S2, S6, S8, S10 for more results of spatial and temporal distribution of critical cytokines.
