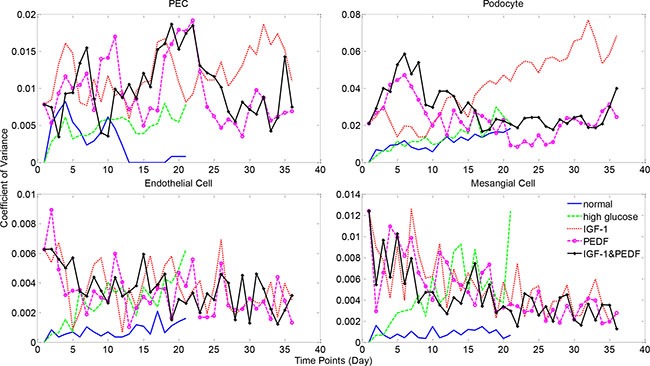
Figure 9. Model uncertainty analysis results for healthy cell numbers.

Simulations were repeated five times with identical parameter settings. Coefficient of variance (CV) was calculated as the ratio of standard deviation to mean cell numbers at each time point. See Supplementary Figure S17 for more uncertainty analysis results.
