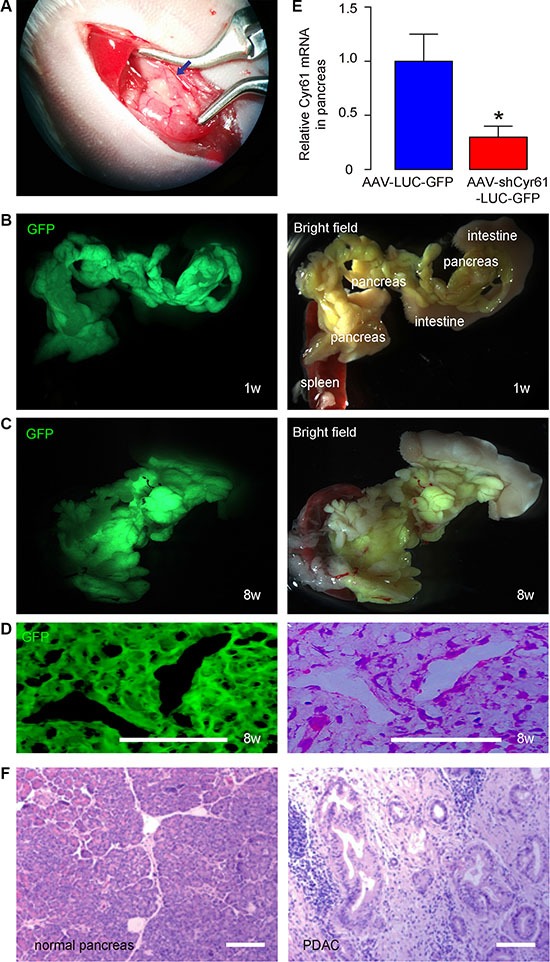
Figure 2. Quality control of intraducal infusion of AAV in mouse pancreas and examination of PDAC formation.

(A) Illustration of surgical performance of intraductal infusion of the pancreas. The blue arrow points to the blunt end of the catheter inside the duct. (B–C) Representative gross images of mouse pancreas 2 days (B) and 8 weeks (C) after intraductal infusion. GFP and bright fields are shown. Anatomic markers are labeled. (D) Immunostaining for GFP on tumor tissue in pancreas section 8 weeks after AAV infusion (left panel) and H&E staining on a consecutive section (right panel). (E) RT-qPCR for Cyr61 in mouse pancreas 2 days after intraductal infusion. (F) Presence of PDAC based on H&E staining shown by representative images. *p < 0.05. N = 20. Scale bars are 50 μm.
