
Figure 4. DSA images of normal rabbit kidneys after renal artery embolization with different formulations: Saline (Plot B1), PSHI-Ca2+ (Plot B2) and PSHI (Plot B3).
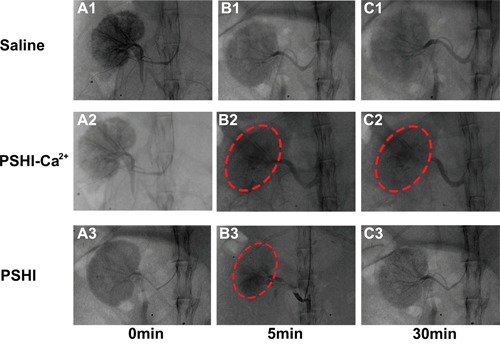
Plots A1, A2, and A3 correspond to DSA images before renal artery embolization, respectively. Plots C1, C2, and C3 correspond to DSA images 30 min after renal artery embolization, respectively. The red circles indicate the embolized kidney.