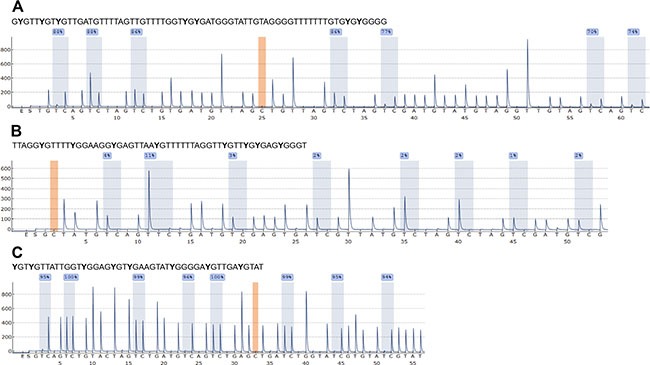
Figure 2. Representative pyrograms for ABCB1 (A), ABCC1 (B) and ABCG2 (C) obtained with in-house developed bisulfite PSQ methods.

Peaks highlighted in blue indicate the methylation status of the CpGs in the sequence to analyze. The position highlighted in orange serves as control for complete bisulfite conversion. Pyrograms were obtained by analyzing the prostate cancer cell line PC-3.
