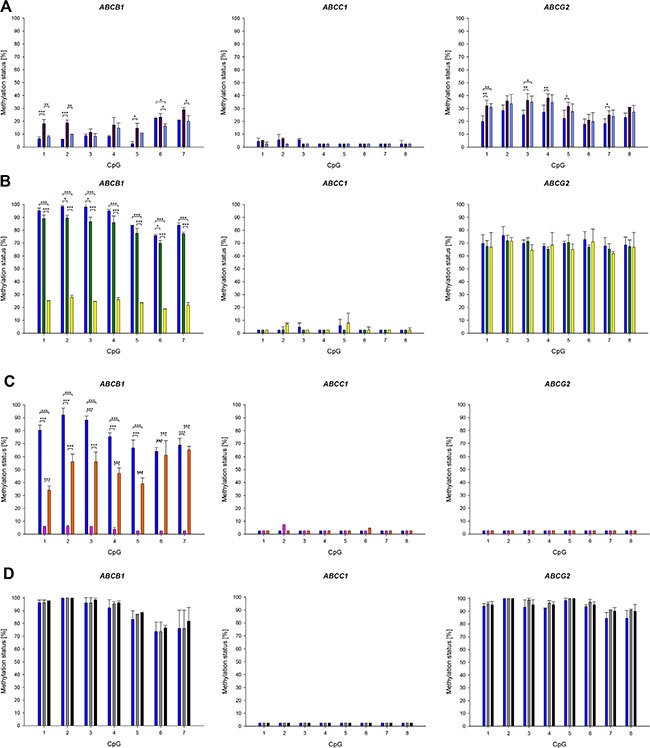
Figure 5. Promoter methylation patterns of ABCB1, ABCC1 and ABCG2 in parental cell lines and their drug-resistant sublines.

(A) GLC-4 (dark blue), GLC-4/adr (purple) and GLC-4/rev (light blue). (B) SW1573 (dark blue), SW1573/2R120 (green) and SW1573/2R160 (yellow). (C) KB-3-1 (dark blue), KB-C-1 (pink) and KB-1089 (orange). (D) HL-60 (dark blue), HL-60/adr (grey) and HL-60/vinc (black). Mean and standard deviation of at least four technical replicates. *p < 0.05, **p ≤ 0.01, ***p ≤ 0.001.
