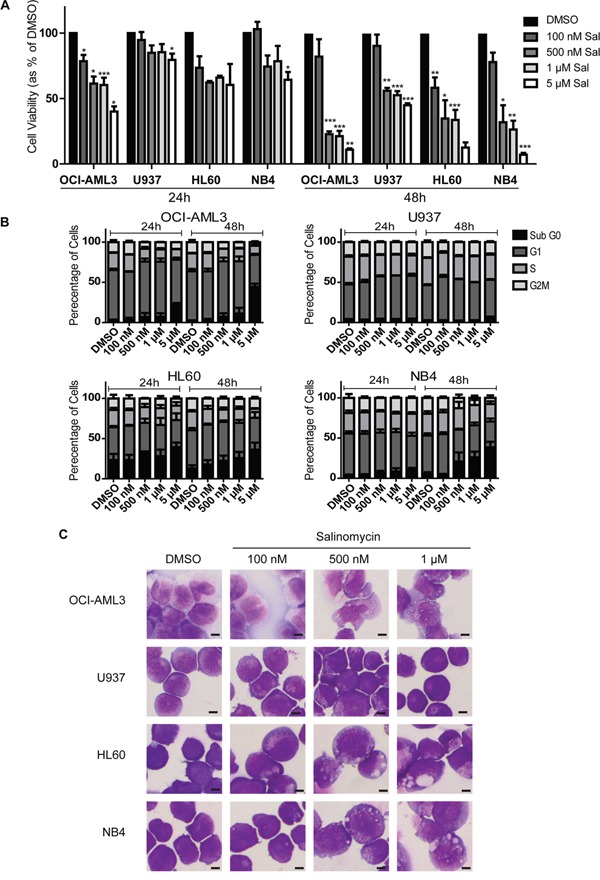
Figure 1. Differential sensitivity of human AML cell lines to salinomycin.

A. Bar graphs showing decreased viability in AML cell lines over time following salinomycin treatment at the indicated dosage compared to 0.01% DMSO vehicle control. B. Bar graphs showing altered cell cycle (Propidium Iodide staining) in AML cell lines over time following salinomycin treatment at the indicated dosage or 0.01% DMSO vehicle control. C. Representative morphology images of AML cell lines treated for 48 hours with salinomycin at the indicated dosages or 0.01% DMSO. Mean values ± S.E.M. of biological replicates (n=3) are plotted throughout. ***P < 0.001, **P < 0.01, *P < 0.05, t-test. Scale bar = 4 μm.
