
Figure 1. Presence of oxMIF in the circulation of cancer patients and healthy controls.
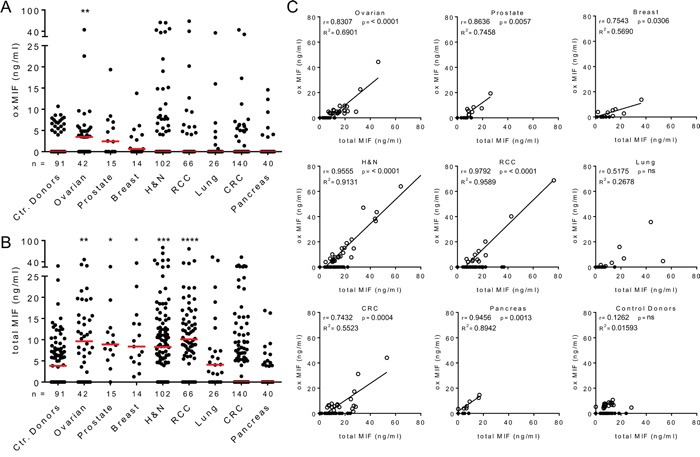
A. Plasma levels of oxMIF in samples from control donors and patients with solid tumors. B. Plasma levels of total MIF in the same samples. Individual values and medians (red lines) are shown. We used the Kruskal-Wallis test followed by Dunn's multiple comparison test for statistical analyses. *p<0.05; **p<0.01***; p<0.001; ****p<0.0001. C. OxMIF levels plotted against total MIF levels for each individual plasma sample. OxMIF positive plasma samples (open circles) and oxMIF negative samples (closed circles) are depicted. We used Pearson correlation analysis and linear regression to correlate MIF and oxMIF levels in each cancer type, excluding oxMIF negative samples (oxMIF = 0 ng/ml).