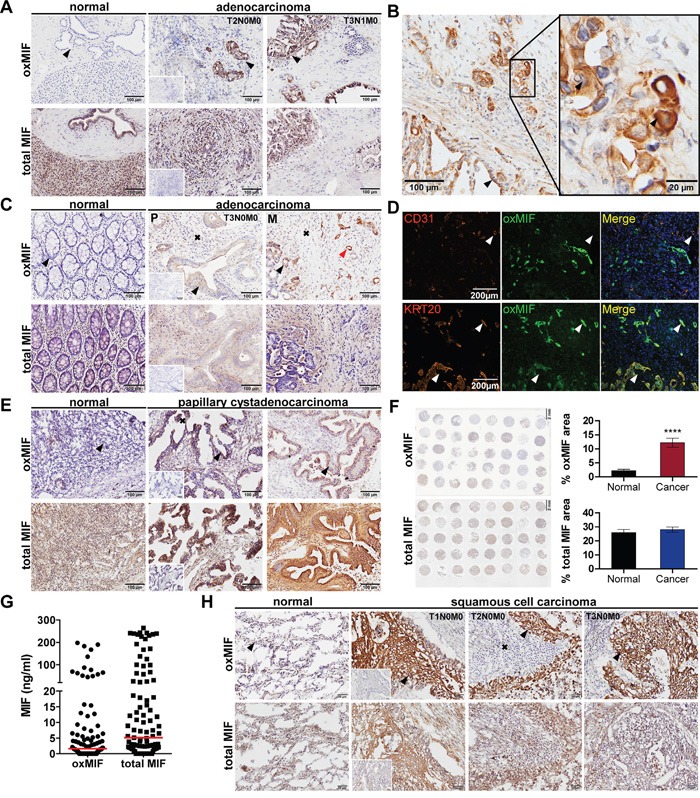
Figure 2. OxMIF occurs specifically in malignant tissue and can be detected in primary tumors and in metastases of different solid tumors.

A. OxMIF and total MIF staining of pancreas tissue with normal morphology and pancreatic adenocarcinoma tissue (tumors were staged according to the tumor node metastasis (TNM) system). B. Ten and 40 fold (inset) original magnification of pancreatic adenocarcinoma stained for oxMIF, arrows indicate location of staining (invasion front, membrane, cytoplasm and nucleus, respectively). C. OxMIF and total MIF staining of colon tissue with normal morphology and colorectal adenocarcinoma tissue, red arrows indicate vessel like structures described in D. D. Top panels show immunofluorescence staining of the blood vessel marker CD31 (red) and oxMIF (green). The overlay reveals no co-localization (white arrow) of these markers in CRC metastasis obtained from the liver. Bottom panels show immunofluorescence staining of the colon epithelial cell marker cytokeratin 20 (KRT20, red) and oxMIF (green). The merge with DAPI nuclear counterstain reveals co-localization (white arrow) of these markers. Scale bar 200 μm. E. OxMIF and total MIF staining of ovarian tissue with normal morphology and ovarian papillary cystadenocarcinoma tissue. F. The left panels show a low magnification image of a tissue micro array consisting of 37 sections of ovarian cancer tissue and 3 adjacent normal tissues, stained for oxMIF and total MIF. Scale bar 2 mm. This microarray has been analyzed by digital images analysis using Definiens Tissue Studio®, and the mean stained tissue area ± SEM are depicted on the right panel. ****p<0.0001, unpaired two-tailed student's t-test. G. Levels of oxMIF and total MIF in ascitic fluid from patients with ovarian cancer. Data are presented as dot-plot of individual samples with median (red lines). H. OxMIF and total MIF staining of lung tissue with normal morphology and lung cancer tissue as indicated. DAB staining and hematoxylin counterstaining. Scale bars 100 μm (if not otherwise indicated). Black arrows and black crosses indicate epithelial cells (in normal tissue) or tumor epithelial cells and tumor stroma respectively, small insets show control staining with matched non-immune isotype IgG.
