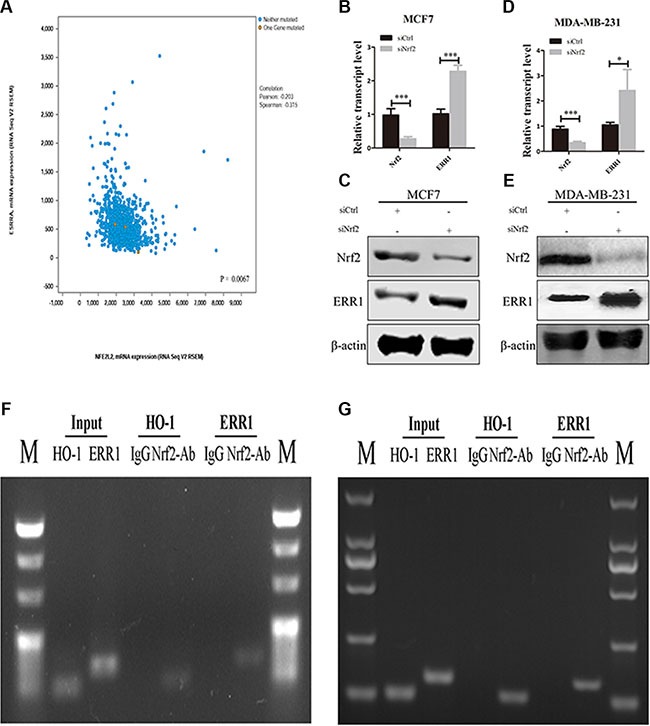
Figure 9. NRF2 negatively regulate the expression of ERR1.

(A) The relationship between NRF2 and ERR1 mRNA expression was retrieved from TCGA dataset using www.cbioportal.org and the correlation was analyzed by Pearson correlation and Spearman correlation. (B, C) The expression of ERR1 mRNA and protein levels was measured by qRT-PCR (B) and immunoblotting (C) in MCF7 cells. (D, E) The expression of ERR1 mRNA and protein levels was measured by qRT-PCR (D) and immunoblotting (E), respectively, in MDA-MB-231 cells. All data are means of three experiments, bar: SD, *P < 0.05; **P < 0.01; ***P < 0.005. (F, G) Binding of NRF2 to the ERR1 or HO-1 promoter in MCF7 (F) and MDA-MB-231 cells (G). Anti-NRF2- or IgG-immunoprecipitated chromatin was amplified using the indicated primer pairs. Results obtained by real-time PCR are expressed relative to amplified input. n = 3. Conventional PCR products from duplicate ChIP were analyzed on agarose gels. Input was diluted 1/100 before PCR. HO-1 gene served as positive control.
