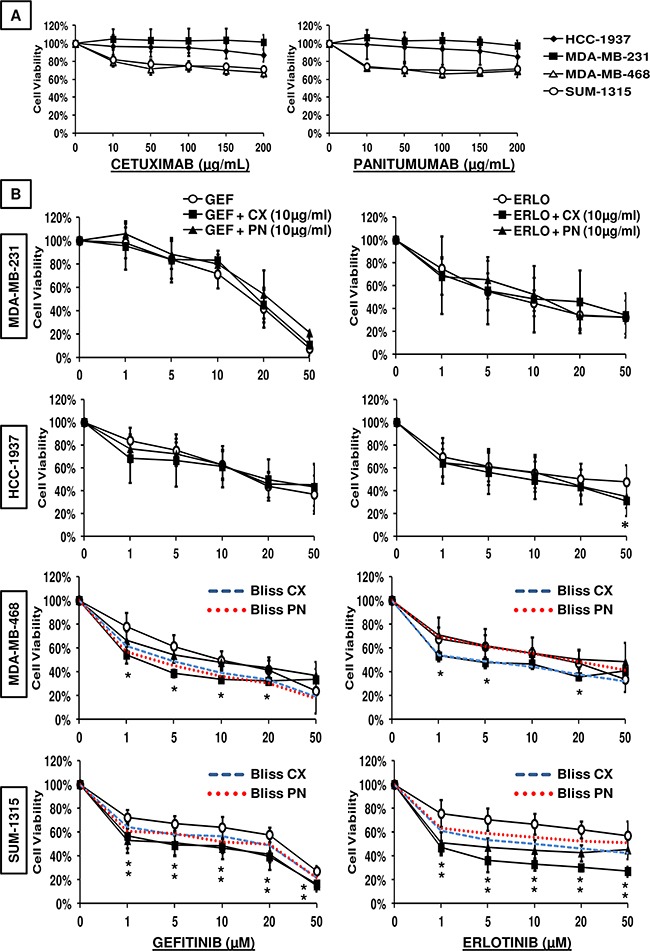
Figure 2. Viability assay of TNBC cell lines treated with anti-EGFR-targeted therapies.

A. Cells were treated for 24 h with increasing concentrations of cetuximab or panitumumab and B. with the indicated concentrations of EGFR-TKIs (erlotinib (ERLO) or gefitinib (GEF)) combined with 10 μg/ml anti-EGFR mAbs (cetuximab (CX) or panitumumab (PN)). Cell viability was assessed using the SRB assay as described in the Materials and Methods. The results are expressed as percent of viability of untreated cells and are the mean values ± SEM of three independent experiments. Dashed curves represent the expected Bliss values if the combined effects were additive. The theoretical Bliss curves are shown for mAb-sensitive cell lines (MDA-MB-468 and SUM-1315). *p<0.05 for comparison using two-way analysis of variance (ANOVA) followed by an unpaired Student's t-test between cells treated with EGFR-TKIs and cells treated with combination therapy.
