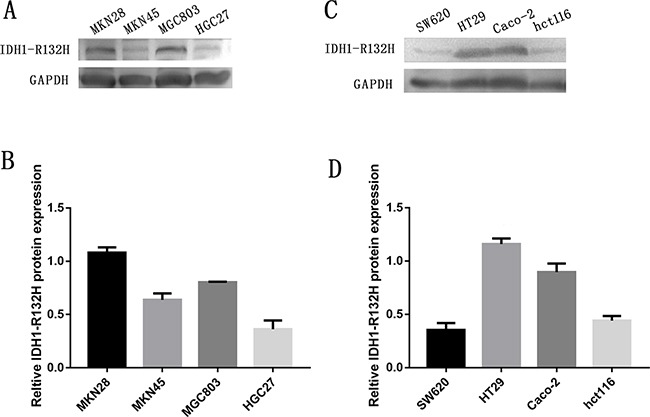
Figure 3. Expression of IDH1-R132H in four GC cell lines and four CRC cell lines.

A. Western blot showing protein levels of IDH1-R132H in GC cell lines with GAPDH as a loading control. B. Intensity of IDH1-R132H quantified by densitometry (software: Image J, NIH). Data are reported as mean±SD (n =3). C. Western blot showing protein levels of IDH1-R132H in CRC cell lines with GAPDH as a loading control. D. Intensity of IDH1-R132H quantified by densitometry (software: Image J, NIH). Data are reported as mean±SD (n =3).
