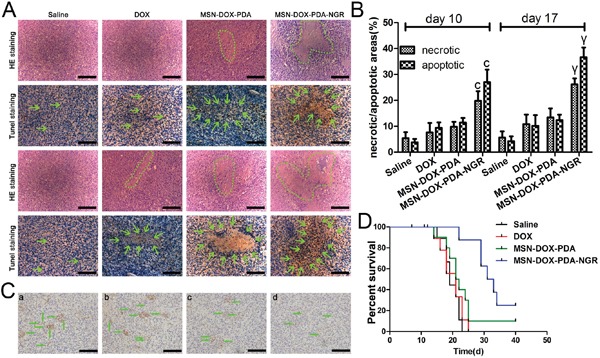
Figure 11. In vivo antitumor and antiangiogenesis effects of dual-targeted NPs.

A. H&E and TUNEL staining after 10 and 17 days (upper and lower two rows, respectively) post transplantation. B. The ratios of the necrotic/apoptotic areas within the tumor. C. CD31-positive microvessels in glioma-bearing rat brains. D. Survival curve (Kaplan-Meier plot) of glioma-bearing rats treated with different DOX formulations. Green circle and arrows in A indicate necrotic regions and cell apoptosis body in tumor interior, respectively; a, control group; b, free DOX group; c, MSN-DOX-PDA group; d, MSN-DOX-PDA-NGR group. Green arrow in C, microvessel; scale bar, 50 μm. cp < 0.001 compared with other groups at day 10; γp < 0.001 compared with other groups at day 17 (n = 5).
