
Figure 9. In vivo distribution of different DOX formulations in brains of glioma-bearing rats.
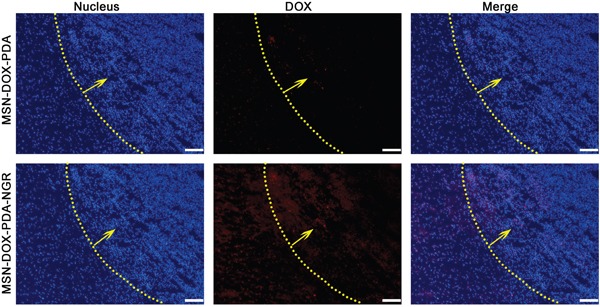
Nuclei were stained with DAPI (blue) while DOX distribution is in red. Yellow line and arrow, border and direction of glioma, respectively; scale bar, 50 μm.