
Figure 4. Effects of LPS on cell motility and proliferation of sw480 and Hct116 cells.
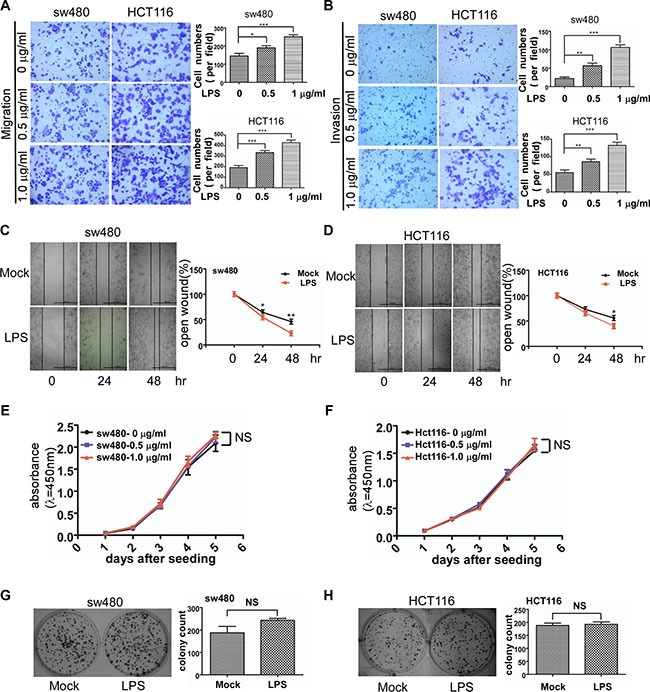
(A and B) Representative images of migrated and invaded colorectal cancer cells through chambers' membrane (100×) treated with LPS ( 0 , 0.5 , 1 μg/ml). Cell numbers were counted in three randomly selected microscopic fields. (C and D) Representative images of mock and LPS-stimulated colorectal cancer cell wound healing (40×). Microscopic observations were photographed 0, 24 and 48 hours after scratching the cell surface. (E and F) Effects of LPS (0 , 0.5 , 1 μg/ml) on cell growth by CCK8 assay. (G and H) Effects of LPS (1 μg/ml) on cell growth by colony formation assay. Error bars represent mean ± SEM, representative of three experiments, *p < %0.05 , **p < %0.01, ***p < %0.001, NS p > 0.05. Scale bars represent 1000 μM.