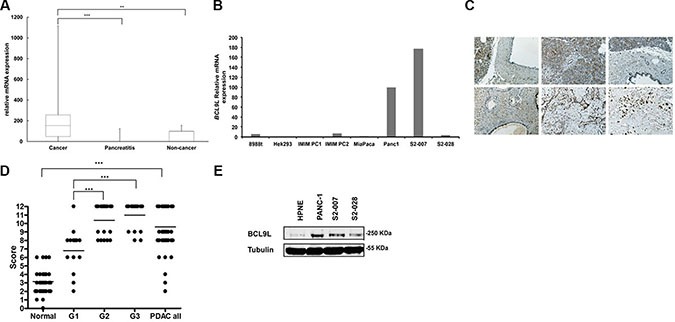
Figure 1. BCL9L expression in primary pancreatic tumor tissue and cell lines.

(A) Box-and-whisker plot showing results from BCL9L mRNA expression analysis by qRT-PCR in tissue samples derived from primary human pancreatic tumors (n = 26 cases), chronic pancreatitis (n = 6 cases) and normal pancreas (n = 13 cases). Expression was normalized to ribosomal protein, large, P0 (RPLP0) mRNA levels. Bars represent median and 2nd and 3rd quartiles (boxes) as well as minimum and maximum values (whiskers). **p ≤ 0.01, ***p ≤ 0.001 (Student's t-test). (B) BCL9L mRNA levels in pancreatic cancer (8988t, IMIM PC1, IMIM PC2, MiaPaca-2, Panc1, S2-007, S2-028) and control (HEK 293) cell lines. (C) Staining of tissue microarrays (TMA) for BCL9L expression using immunohistochemistry. Enhanced expression was seen in PDAC tissues (bottom panels) compared to normal pancreas (upper panels). Staining intensity in PDAC tissues increased with tumor grade (bottom left: G1, bottom middle: G2, bottom right: G3). (D) BCL9L staining intensity of tissue microarrays was quantitatively evaluated and scored in normal and PDAC cases as described in Materials and Methods. Scores significantly increased with the progression to less differentiated PDAC (grade 2 and 3). ***p ≤ 0.001 (Mann-Whitney and Kruskal-Wallis non parametric test) (E) BCL9L protein expression in pancreatic cancer and control (HPNE) cell lines was quantified by western blotting. Detection of α-tubulin was used as a loading control. Shown is a representative image of 3 experiments.
