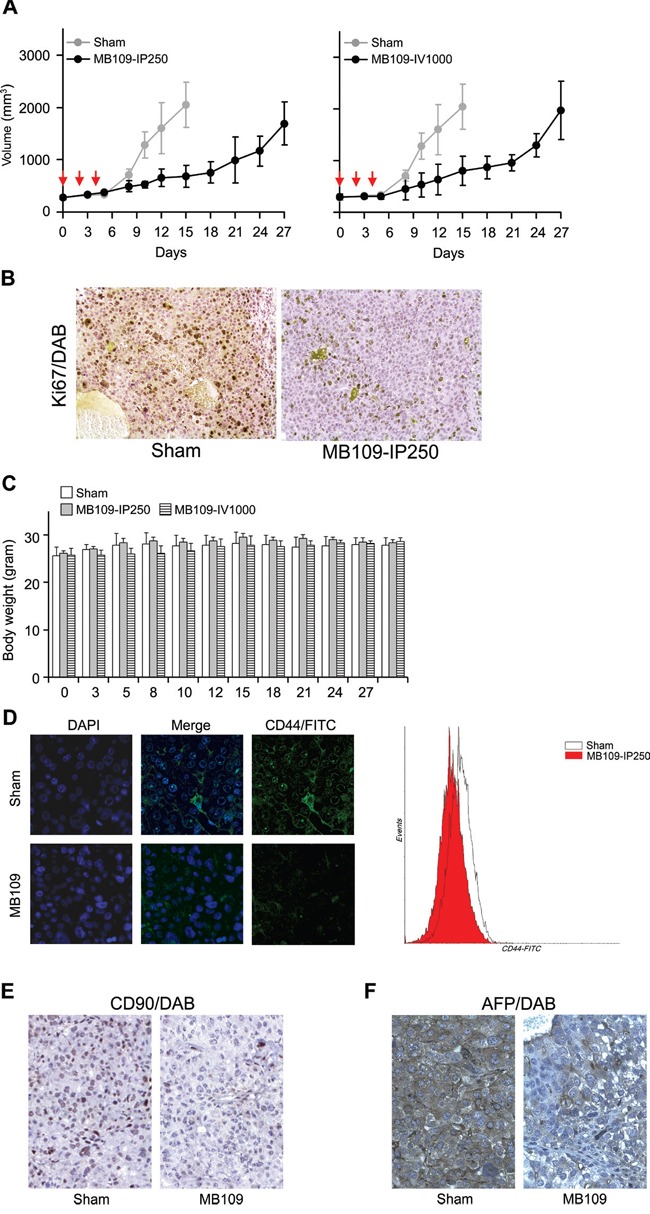
Figure 6. MB109 suppresses Hep3B cell growth and LCSC population in mouse xenograft model.

A. Time course analysis of tumor growth. MB109 was injected at 250 intraperitoneally (left panel), or 1000 μg/kg intravenously (right panel). Inhibition of tumor growth was observed in both experimental groups. Red arrows indicate the three time points of injection. The results are shown in means±SD (Sham, n=5; MB109-IP250, n=6; MB109-IV1000, n=4-5, one mouse was dead at day 8). B. IHC analysis of xenograft tumor from sham and MB109-IP250 group. Paraffin sectioned tissues were stained with proliferation marker Ki67/DAB (brown) and counterstained with hematoxylin (purple). C. No difference of the body weight was observed among the mice groups. D. Immuno-fluorescence images show that the expression of CD44 on the xenografted tumor tissue of the MB109-IP250 group was reduced as compared to that of the Sham group. CD44 antibodies were conjugated with FITC. Tumor tissues were nuclear counter stained with DAPI (left panel). CD44+ populations from the tumors were compared using FACScan (right panel). Immunohistochemistry images show that the expression of CD90 E. and AFP F. on the xenografted tumor tissue of the MB109-IP250 group was reduced as compared to that of the Sham group. Antibody bound regions of CD90 and AFP were visualized with DAB and counter stained with hematoxylin.
