
Figure 1. Specific lncRNA expression pattern in ETV6/RUNX1-driven BCP-ALL.
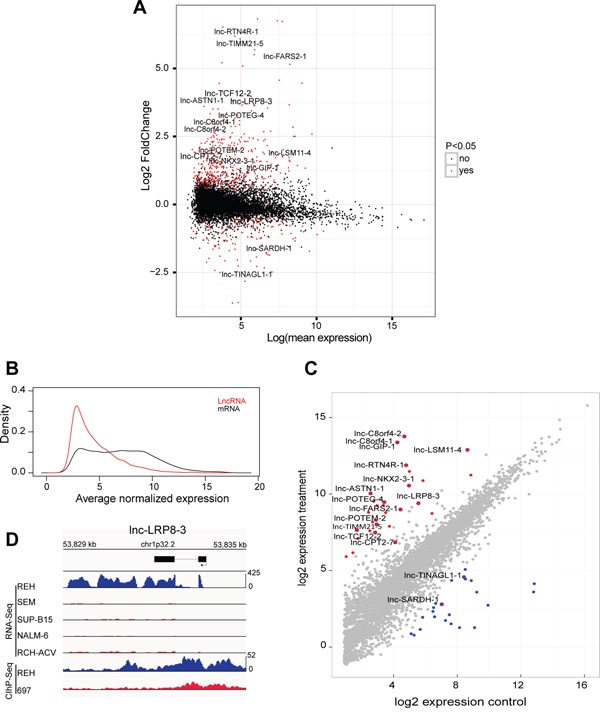
A. MA-plots, which display the mean expression and fold change of differentially expressed lncRNAs in ETV6/RUNX1 driven leukemias (adjusted p-value < 0.05) identified by microarray expression profiling B. Density plot of average normalized expression values for lncRNAs and mRNA transcripts in 25 ETV6/RUNX1-positive BCP-ALLs C. Diagonal plot that represents differentially up-regulated (Red) and down-regulated (Blue) lncRNAs in an ETV6/RUNX1-positive BCP-ALL cell line identified by RNA-sequencing of 13 BCP-ALL cell lines (adjusted p-value < 0.05). D. RNA sequencing tracks that represent expression of lnc-LRP8-3 in five BCP-ALL cell lines and H3K27ac binding patterns (ChIP-Seq) of the same genomic locus in REH and 697 cells.