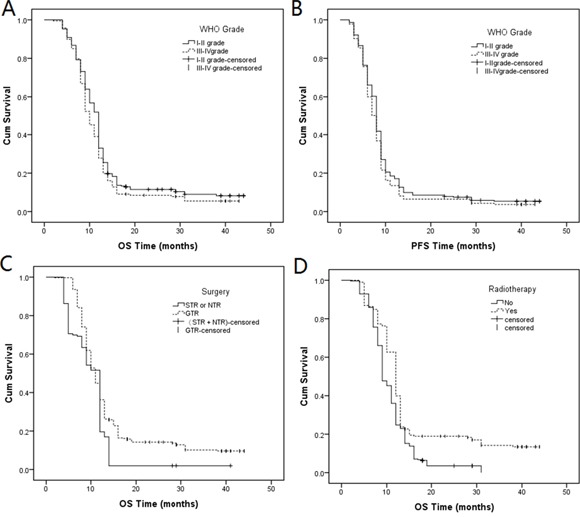
Figure 2. Kaplan-Meier curves of A. OS (log-rank P = 0.039) and B. PFS (log-rank P = 0.12) between grade I–II and grade III–IV tumors; Kaplan-Meier curves of the distribution of C. surgery (log-rank P = 0.000) and D. radiotherapy (log-rank P = 0.000) in OS.

