
Figure 1. The DFS and OS curves for nLNR and LNR categories.
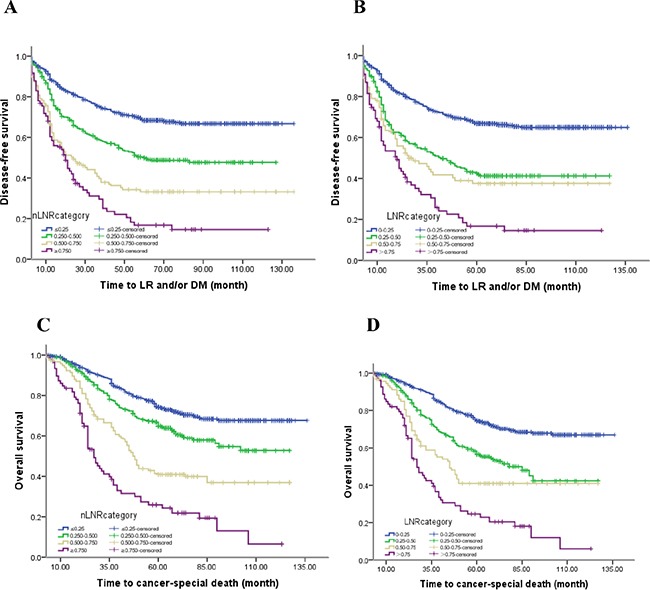
The 5-year DFS rates for A. the nLNR category (68.3%, 48.4%, 33.3% and 16.5%, P<0.0001; all statistically different, P<0.005), and B. the LNR category (66.7%, 41.0%, 37.3% and 16.6%, P<0.0001; all statistically different, P<0.001, except LNR 2 versus LNR 3; X2=1.989, P=0.158), The 5-year OS rates of C. the nLNR category (71.8%, 60.1%, 42.7% and 21.8%, P<0.0001; all statistically different, P<0.0001), and D. the LNR category (71.7%, 53.4%, 40.6% and 20.3%, P<0.0001; all statistically different, P<0.002).