
Figure 3. The ROC curves of nLNR, npLNs (TDs plus pLNs), LNR, and pLNs for predicting DFS and OS in patients with less than 12 nodes.
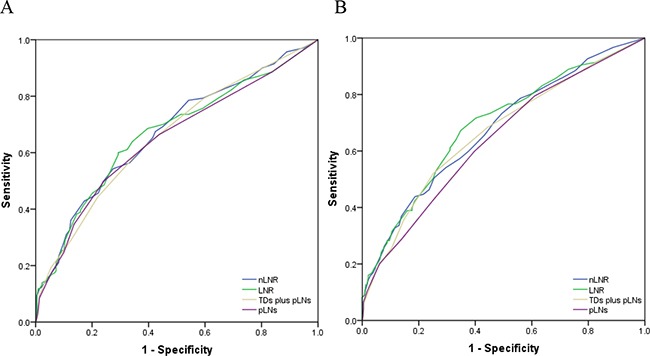
A. The AUC of nLNR, npLNs, LNR, and pLNs for predicting DFS were: 0.670 (95% CI 0.629-0.711), 0.666 (95% CI 0.625-0.708), 0.658 (95% CI 0.616-0.699), and 0.648 (95% CI 0.606-0.690), respectively (all P<0.0001). B. The AUC of nLNR, LNR, npLNs, and pLNs for predicting OS were: 0.675 (95% CI 0.634-0.717), 0.689 (95% CI 0.647-0.730), 0.664 (95% CI 0.621-0.707), and 0.640 (95% CI 0.597-0.683), respectively (all P<0.0001).