
Figure 2. Native RHAMM mRNA expression levels in monocytes and mo-DCs.
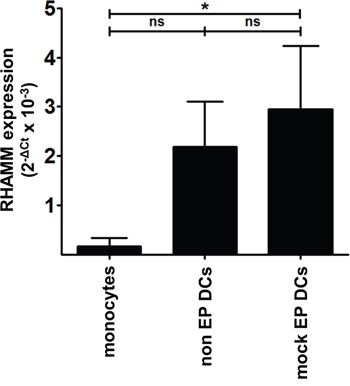
Total cDNA from monocytes, non EP DCs and mock EP DCs served as template to determine RHAMM mRNA expression levels in these cells by qPCR. Results were analyzed using the ΔCt method and normalized to the mean of GAPDH and YWHAZ expression. Data are depicted as mean 2−ΔCt values (+ SD) from 3 independent donors; ns not significant, *P < 0.05, one-way ANOVA with Bonferroni posthoc test.